Identify potential Altcoin setups using Futures Volume Bubble Maps.
This indicator is ideal for spotting tops & bottoms by tracking futures trading volume and its rate of change.
Cooling = potential bounce 📈
Overheating = possible top ⚠️
Examples below 👇🧵
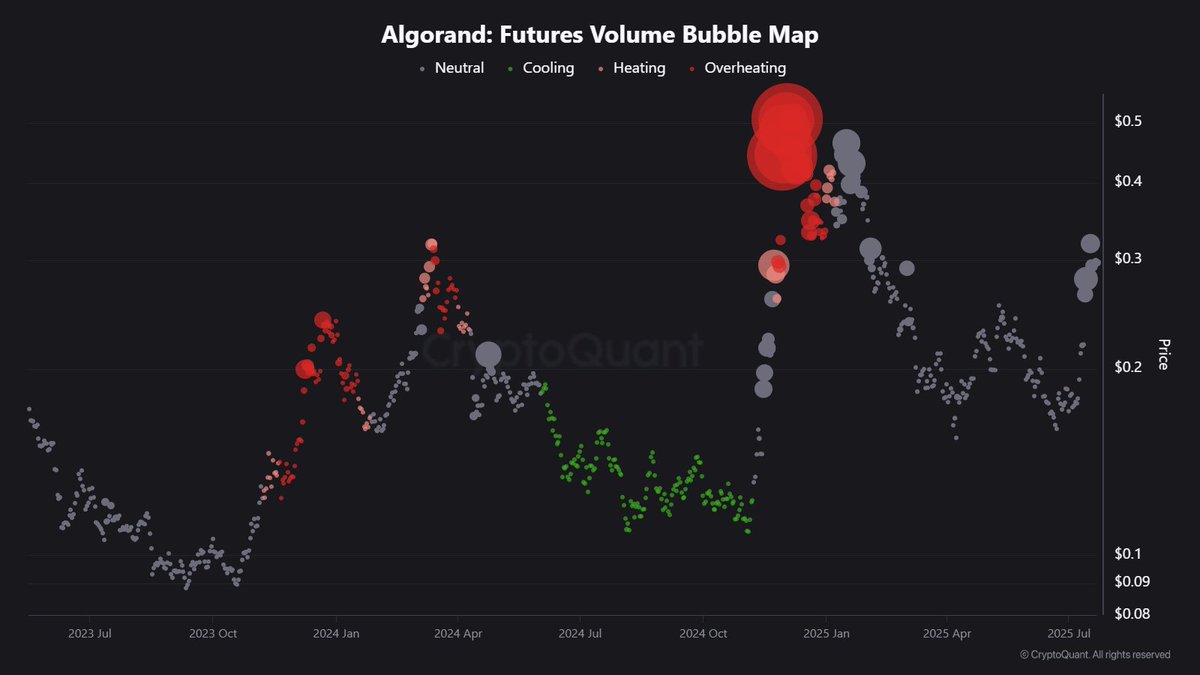
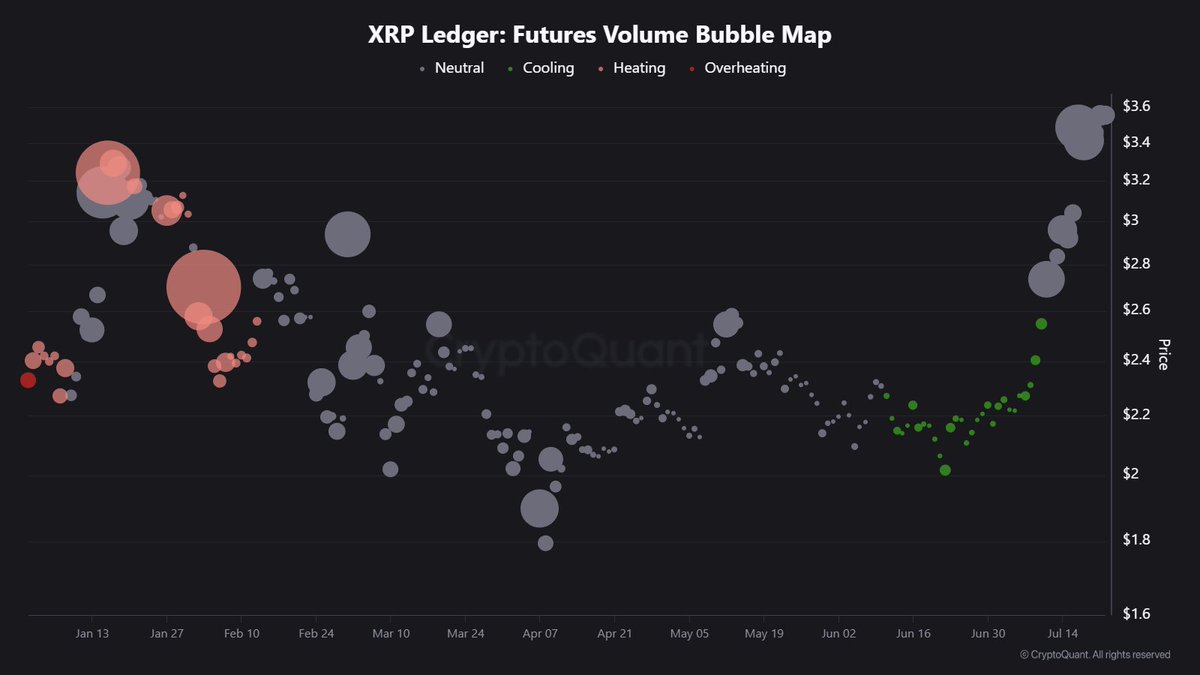
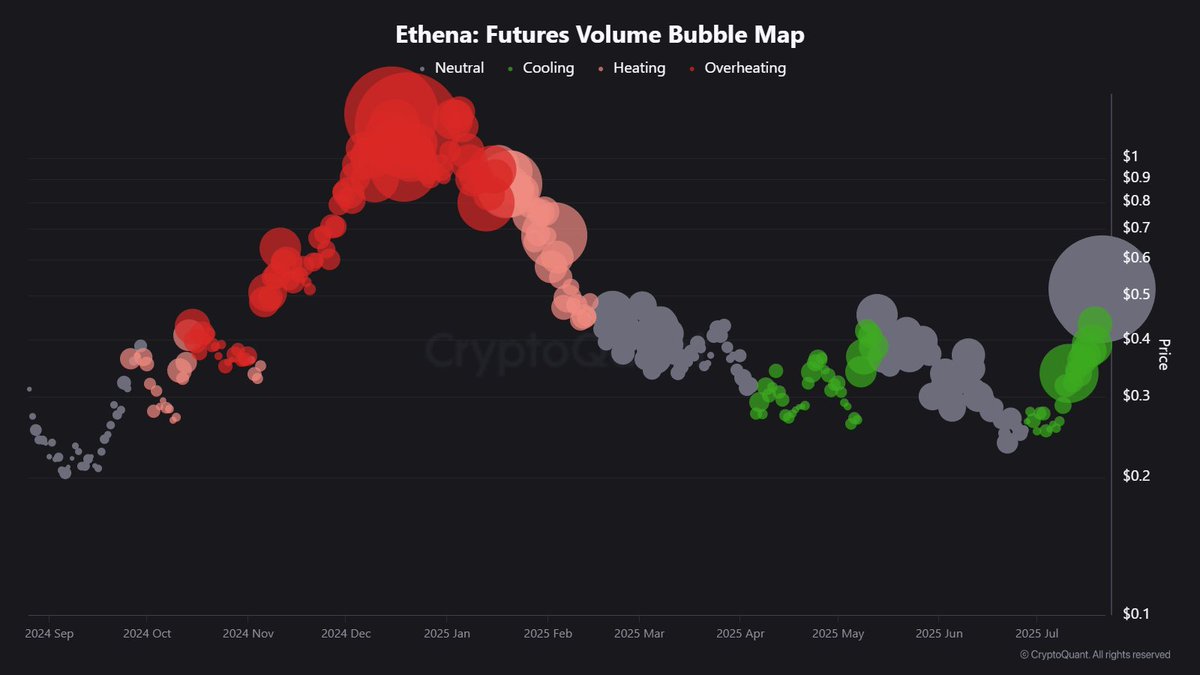
Cooling = Potential Bounce 🟢➡️📈
When the market’s in a bull phase and futures volume cools off, it often sets the stage for the next leg up.
Case in point:
🔹 $XRP
🔹 $SUI
Both showed cooling signs, and now they’re bouncing!
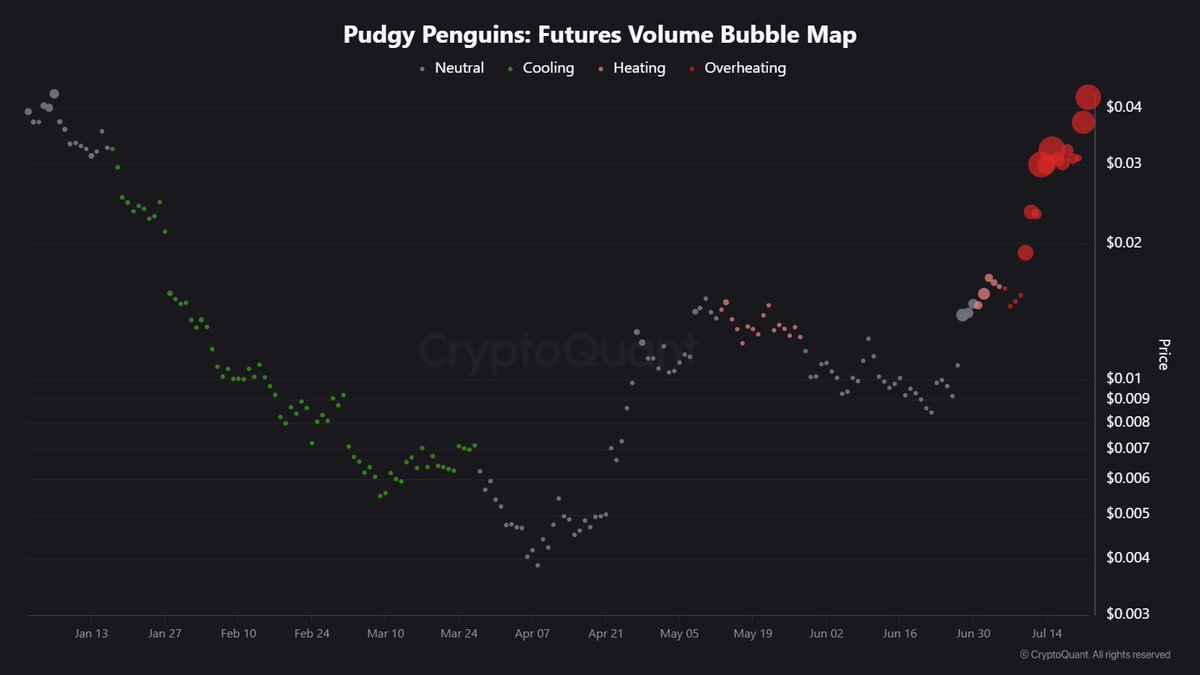
Overheating + Weak Price = Distribution Phase ⚠️
In late-stage bull markets, sustained high futures volume with flat or weak price action often signals distribution — smart money exiting.
Current examples:
🔸 $HYPE
🔸 $PENGU
Both are currently showing signs of overheating.
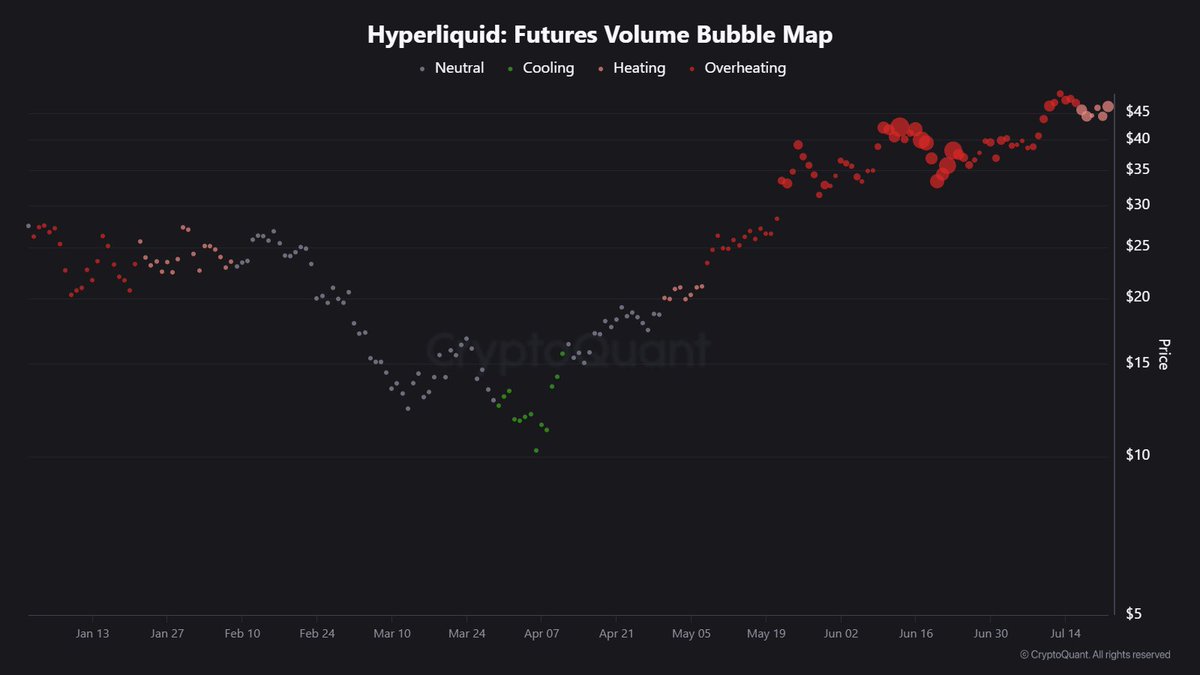
Check this for 50+ altcoins 👇
23.74K
75
The content on this page is provided by third parties. Unless otherwise stated, OKX TR is not the author of the cited article(s) and does not claim any copyright in the materials. The content is provided for informational purposes only and does not represent the views of OKX TR. It is not intended to be an endorsement of any kind and should not be considered investment advice or a solicitation to buy or sell digital assets. To the extent generative AI is utilized to provide summaries or other information, such AI generated content may be inaccurate or inconsistent. Please read the linked article for more details and information. OKX TR is not responsible for content hosted on third party sites. Digital asset holdings, including stablecoins and NFTs, involve a high degree of risk and can fluctuate greatly. You should carefully consider whether trading or holding digital assets is suitable for you in light of your financial condition.

