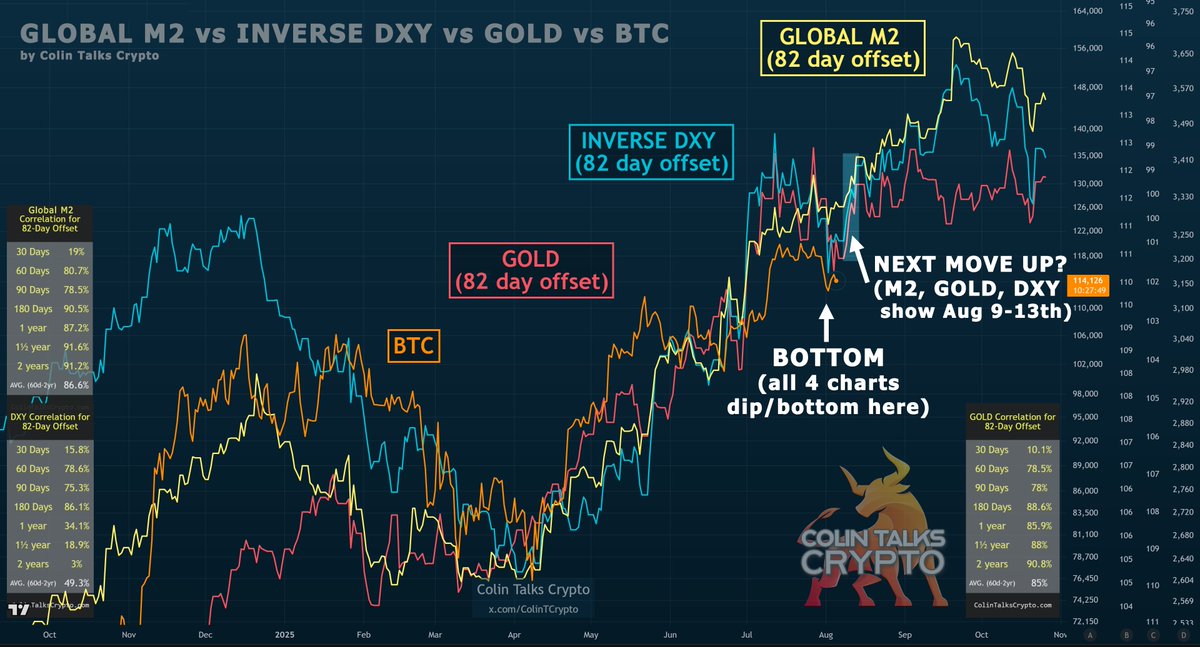
Next $BTC move-up prediction: August 9-13th
This is an EXPERIMENT to see if 3 charts (Global M2, Inverse DXY, and Gold) act as confluence, and if they can predict *when* BTC's next short term price move up will begin for BTC.
Pictured:
• Global M2 [yellow line]
• Inverse DXY [blue line]
• Gold [pink line]
Each was offset by 82 days to match the most recent price moves. This offset was chosen purely visually and for recency. It was overfitted on purpose. For a longer term view (which is not what we're looking at here) an offset of about 90 has a stronger average correlation.
I want to be very clear: this is just an attempt at guessing the next short term move based on short term confluence. This is NOT intended to give some big macro picture. This is an EXPERIMENT to see if these three charts can offer us increased odds of determining the next short term price move correctly. Let's watch and see. 🍿

It's fascinating that all 3 charts (Global M2, Inverse DXY and Gold) all have a roughly 3 month lead on $BTC.
63.32K
1.04K
The content on this page is provided by third parties. Unless otherwise stated, OKX TR is not the author of the cited article(s) and does not claim any copyright in the materials. The content is provided for informational purposes only and does not represent the views of OKX TR. It is not intended to be an endorsement of any kind and should not be considered investment advice or a solicitation to buy or sell digital assets. To the extent generative AI is utilized to provide summaries or other information, such AI generated content may be inaccurate or inconsistent. Please read the linked article for more details and information. OKX TR is not responsible for content hosted on third party sites. Digital asset holdings, including stablecoins and NFTs, involve a high degree of risk and can fluctuate greatly. You should carefully consider whether trading or holding digital assets is suitable for you in light of your financial condition.

