🚨Bitcoin skyrocketed to $122,000, with technical resistance looking at 136,000. MVRV and profit-loss ratios have both entered critical territory【Investment Allocation Series 03】
🔵Next resistance level: $136,000 is a key technical and sentiment level.
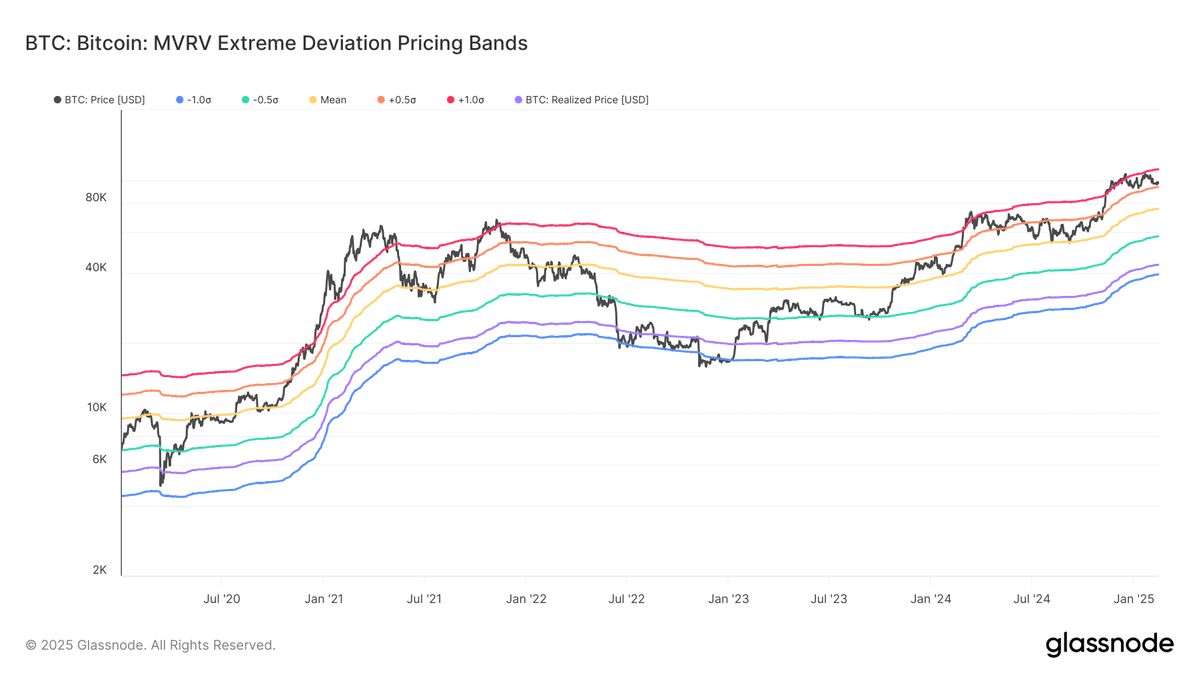
Bitcoin has recently surged to $122,000, setting a new historical high. It has not only broken through the short-term cost range but has also reached an extreme structure above "+1 standard deviation."
If this momentum continues to expand, the next key target at the technical level will be $136,000, corresponding to the pressure band of two standard deviations. The entry cost for short-term holders in the past has been a point for profit-taking and local market peaks, thus it can be seen as a noteworthy "overheating signal."
🔵Assessing valuation deviation: MVRV Z-Score vs. standard deviation analysis of realized price.
In terms of the deviation between Bitcoin's price and realized price (MVRV), it is based on the overall on-chain capital cost structure to estimate whether the market is overheated or oversold. According to the chart data, the probability of the price staying above ±2σ for a long time is extremely low, so the red area on this chart (+2σ) is a warning signal for a bubble top, while the blue area (-2σ) often represents a long-term bottom.
Just to clarify ⚠️: The deviation of the realized price and the MVRV Z-Score indicator are not the same data content, in case someone thinks they are similar data.
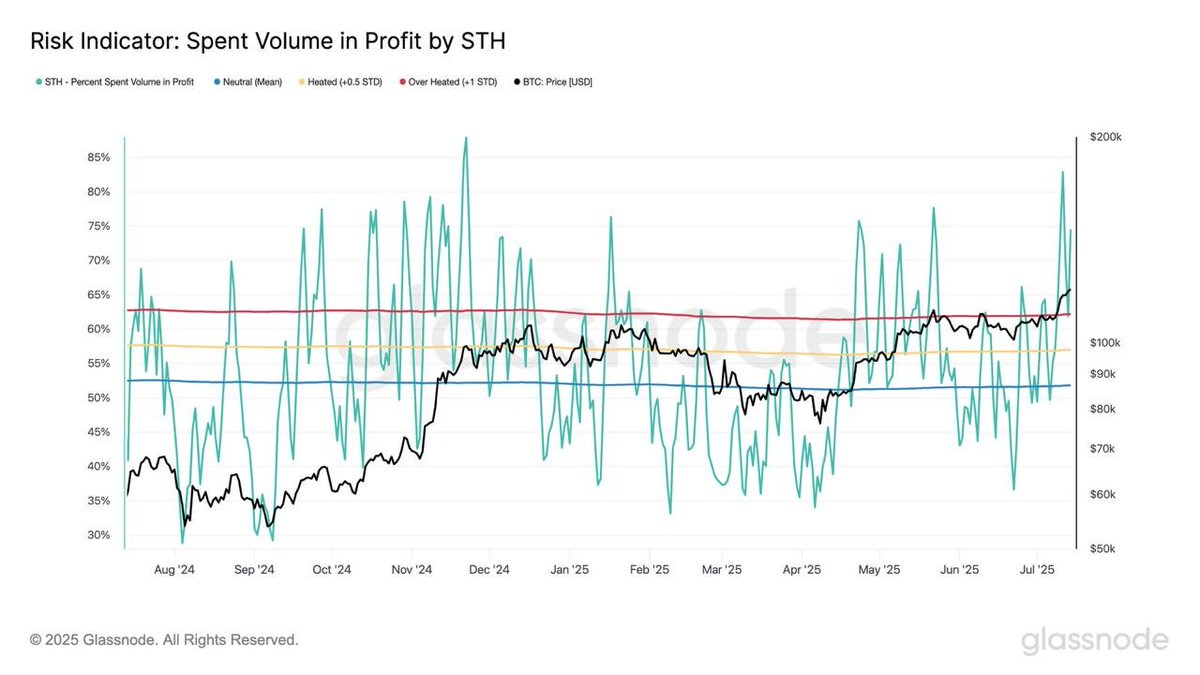
🔵Short-term holders are fully in profit: 88% threshold has been breached, selling pressure is gathering.
From the on-chain data charts, short-term holders are currently 100% in floating profit, breaking through the 88% threshold, which has historically been seen as a risk watershed, and entering an area where irrational exuberance is likely to occur based on historical statistics. Observing from the perspective of circulating chips, the market currently lacks sufficient "stuck positions" to support price fluctuations, making potential short-term profit-taking selling pressure even greater.
🔵Profit-loss ratio skyrocketed to extremes: 39.8x warning and historical correspondence.
Other data charts show that the current ratio of realized profits to realized losses has seen the 7-day EMA for short-term holders soar to 39.8 times, far exceeding the statistically significant extreme range. Structural overheating phenomena often appear more than once before the market peaks, accompanied by increasingly intense volatility.
From the above data chart, Bitcoin's price and on-chain activity are synchronously entering the typical high-temperature zone at the end of a bull market, with prices hitting new highs, profit concentration, overheated sentiment, and a highly consistent optimistic state of chips.
However, the above views lean towards the idea that the short-term of the bull market is starting to overheat. The mid to long-term trend of Bitcoin may not yet be at its end. Below are the indicators that the editorial team believes confirm that we are just entering a "big bull market."
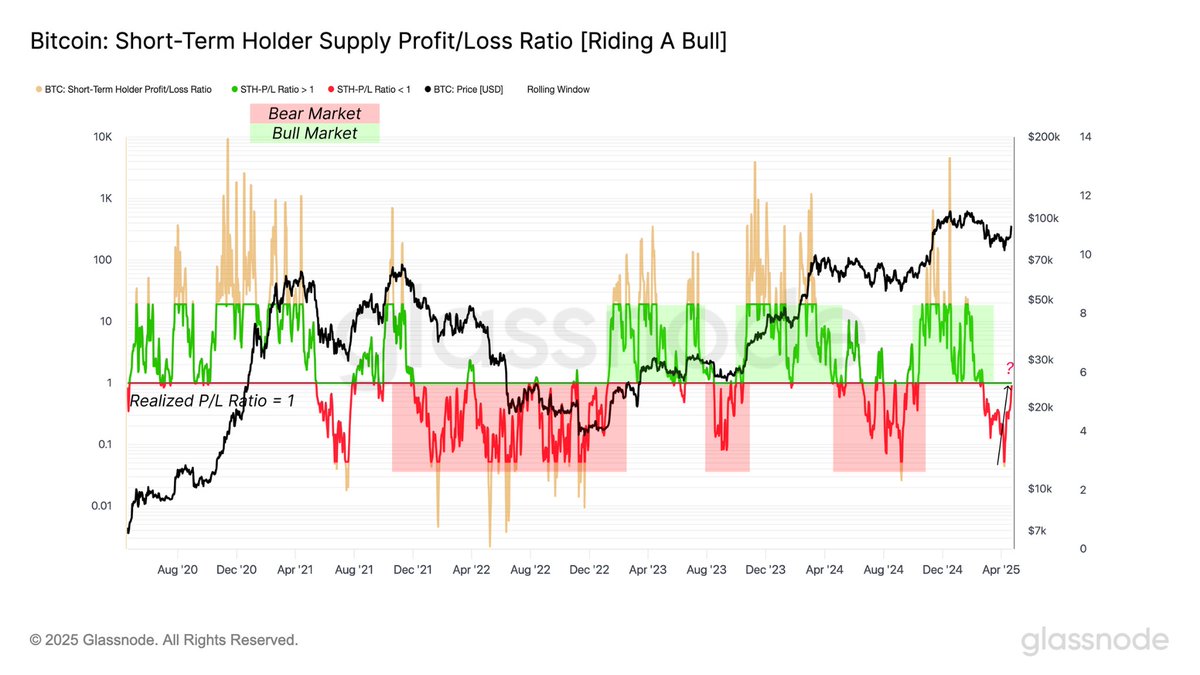
🔵Long-term has not yet peaked: Bull-bear boundary indicator has just confirmed a bullish turn.
According to the data chart, if the profit-loss ratio yellow line officially breaks above 1, transitioning from a continuous months-long loss area (red) to a profit area (green). This reversal not only symbolizes that short-term chips are moving from passive selling to active cashing out but also indicates that prices have returned above short-term costs, with the overall market entering a stage of net capital inflow. Structurally, this is an important confirmation signal for "bull market certainty."
The profit-loss ratio is currently only in the range of 3-4 times, and from a historical perspective, it has not yet entered extreme euphoria. At the end of the bull market in 2021, the profit-loss ratio for short-term holders once soared to over 50 times. Compared to that period, while the current market has warmed up, it has not yet reached the technical conditions of the bubble zone.
Currently, we are in the mid-stage of the bull market's profit period, not the end stage, but this does not mean that the risks can be ignored. The profit-loss ratio has risen from a low point, and the upward trend is gradually accelerating, indicating that the crypto market is gradually releasing profit pressure. Once the profit-loss ratio continues to rise above 8-10 times, it will begin to approach the historical risk zone on-chain, causing most investors to start continuous selling pressure.


⚠️ Investment Warning: This series of content is for general information sharing only and is not investment advice. All asset allocations or market views are for reference only and do not take into account the risk tolerance, financial goals, and funding status of any individual investor. Investing involves risks, market performance may fluctuate, and past performance does not guarantee future results. Investors should assess risks independently and consult a professional advisor if necessary.
2.42K
3
The content on this page is provided by third parties. Unless otherwise stated, OKX TR is not the author of the cited article(s) and does not claim any copyright in the materials. The content is provided for informational purposes only and does not represent the views of OKX TR. It is not intended to be an endorsement of any kind and should not be considered investment advice or a solicitation to buy or sell digital assets. To the extent generative AI is utilized to provide summaries or other information, such AI generated content may be inaccurate or inconsistent. Please read the linked article for more details and information. OKX TR is not responsible for content hosted on third party sites. Digital asset holdings, including stablecoins and NFTs, involve a high degree of risk and can fluctuate greatly. You should carefully consider whether trading or holding digital assets is suitable for you in light of your financial condition.

