Trader's Observation|What will happen after Bitcoin breaks through a new high?
Exactly one year ago, Trump was shot in the right ear during a campaign rally speech and left a historic fist photo, after which he was elected president and officially launched the crypto capital program in the United States, and the price of bitcoin broke through $120,000 from $60,000 a year ago.
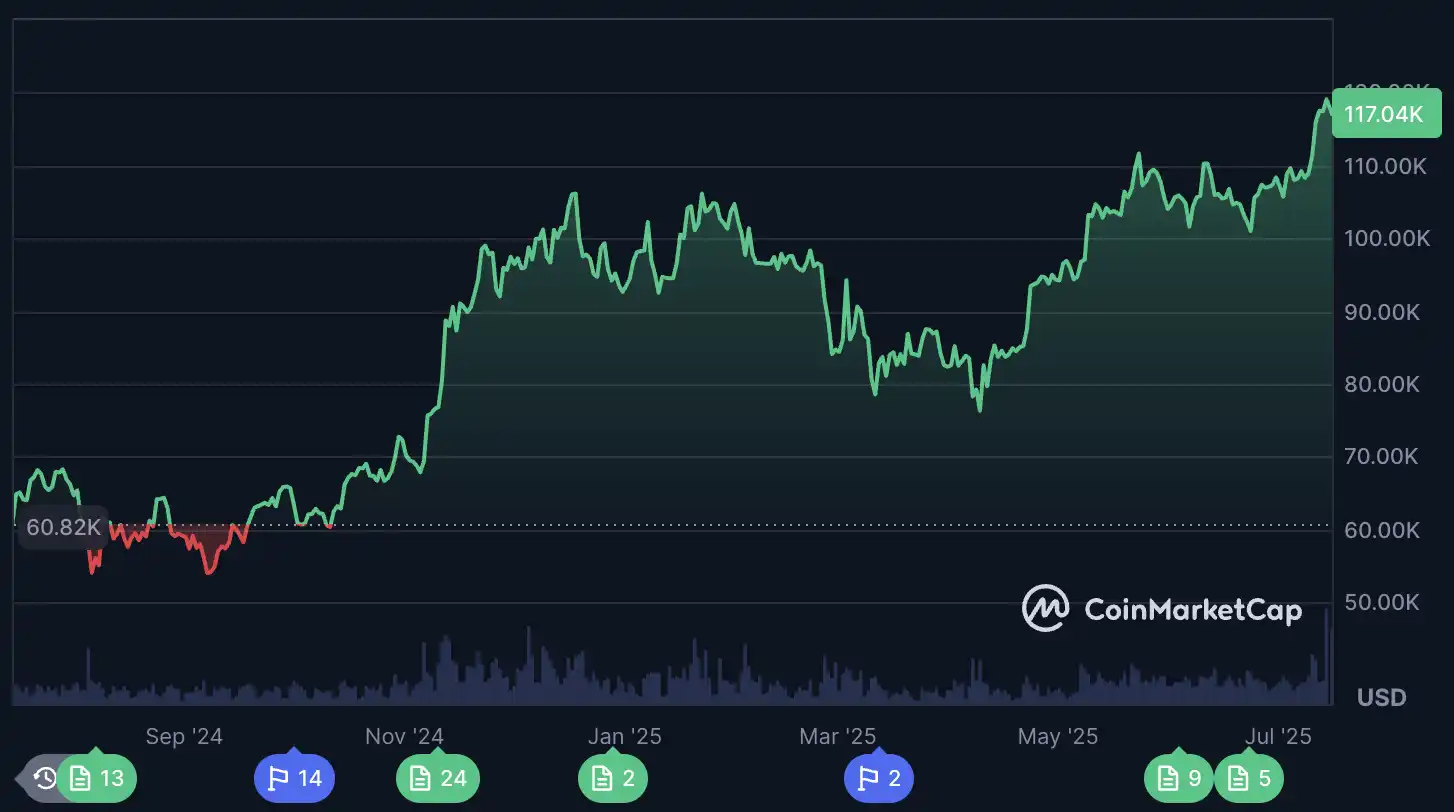
And this year has not only changed the price of bitcoin, but the market structure of cryptocurrencies has also undergone a great change during this period. What is the impact of Bitcoin's widespread consensus on the market? What will the policy trend be, where will cryptocurrencies go?
After 120,000 Bitcoin, everything has to start over. This article will share the views of multiple traders on the crypto market as Bitcoin breaks new highs.
Macro policy winds
Regulatory Dividing Lines: The CLARITY Act
The most high-profile crypto-related bill in recent times is the upcoming vote on the CLARITY Act on Wednesday, which will define the boundaries of crypto regulation.
Mark Palmer, an analyst at Benchmark Investment Firm, said in a new research note that the CLARITY bill could be a turning point in the digital asset market, with many institutions so far remaining on the sidelines due to uncertainty over legal compliance, and the legislation could provide long-awaited regulatory certainty for traditional financial institutions such as asset managers, hedge funds and banks.
The trader "@Trader_S18" believes that with the change of regulatory power from the SEC to the CFTC, the market may usher in a major adjustment of the underlying logic, and the currency ecology will also be differentiated: mature assets such as Bitcoin and Ethereum may be clearly classified as CFTC supervision, while other currencies that do not meet the CFTC standards will still be subject to SEC supervision, forming a pattern of coexistence of commodity contracts and investment contracts.
At the same time, trading platforms may need to re-register with the CFTC and complete the compliance process, and the spot market is expected to develop in the direction of commodity futures-like standardization. If the CFTC regulation is looser and clearer, which is seen as positive, the market may stage a "currency swap wave" in the future, and various projects will actively "stand in line" to obtain more favorable regulatory attribution, promoting a new round of market rotation.
What will be the impact of a possible rate cut?
With the Fed's decision to keep the federal funds rate unchanged in a range of 4.25%-4.5% at the June 17-18 FOMC meeting, and Fed Chair Jerome Powell said the Fed may have started cutting rates without the Trump administration's new tariffs that could push inflation higher. There are also two voices in the market, one is that Fed Chairman Jerome Powell may "consider" resigning, as the Trump administration continues to press, which will greatly increase the probability of a rate cut at the FOMC meeting on July 30.
However, according to CME FedWatch data, the probability of a rate cut at the July 30 FOMC meeting has been reduced to 5% from 24% in June, and the market widely expects that the first rate cut may be delayed until September or December.
While it's uncertain whether it's July or September, it seems that the trend of rate cuts is already quite clear. Trading observer BTCAB5 is optimistic, saying that BTC could hit $135,000 if the rate cut lands on July 30. In addition, Standard Chartered even expects $250,000 by the end of 2025. Rate cut expectations are also positive for compliant tokens such as XRP and SOL, especially as the GENIUS bill vote approaches. Morgan Stanley even predicts that by the end of 2026, the Fed may cut interest rates seven times, bringing them to 2.5%-2.75%, which provides long-term tailwinds for risk assets such as crypto.
CPI expectations
Well-known KOLs @unaiyang said that the US June CPI data to be released at 20:30 tonight will be a decisive factor in the short-term market, directly affecting the price direction of Bitcoin and Ethereum. The current consensus expectation is for core CPI to come in at 3% and CPI at 2.7% y/y. "A weaker-than-expected data could trigger a pullback in Treasury yields, a weaker dollar, and a boost in risk assets, with Bitcoin expected to return to the $122,000 range and Ethereum to $3,200," she said. However, if the inflation data still shows "stickiness", it could dampen market sentiment, and BTC may pull back to the $115,000–$116,000 range in the short term, and ETH may also fall towards the $3,000 mark."
The market is currently in a tight state, and macro data has become the only variable that traders pay close attention to. Against the backdrop of high pressure and unclear direction, more investors choose to wait and see, waiting for clear guidance from macro data. The release of CPI tonight may become the fuse for the next round of market ups and downs.
When will the buying frenzy of listed companies subside, and how will it affect cryptocurrencies?
As more and more listed companies transform into "crypto vaults", the influence of ETFs is waning, and the influence of listed companies and institutions on cryptocurrencies is gradually rising. KOL moneyordebt pointed out that to sustain Bitcoin's power-law rally, a huge amount of new capital is needed, and only institutions can provide such a large volume. Fortunately, institutional adoption itself is also accelerating exponentially, especially as corporate "BTC vaults" are taking over from ETFs as the main driver of price increases. Bitwise's principal investigator @Andre_Dragosch also expressed the same sentiment by citing data, stating that "retail growth is almost nowhere to be found, and the latest round of gains is largely institutional-driven."
On-chain analyst @_43A6 also uses the mNAV data of listed companies as one of the trading indicators based on the theory of the well-known trader James Check, as well as two auxiliary indicators, Days to Cover and Days to Replace. mNAV (market capitalization-to-net value ratio) has become a key indicator to judge a company's intention to buy and sell Bitcoin: when mNAV is higher than 1, it means that the company's market value is higher than the value of its Bitcoin position, and there is an incentive to issue additional shares to acquire Bitcoin; When the mNAV is below 1, it may prompt the company to sell bitcoin to buy back shares, thus repairing the deviation in market capitalization. Once mNAV is rapidly compressed in multiple leading companies, it may trigger collective deleveraging, bringing a chain reaction.
Bitcoin Reserve Corporation's mNAV Kanban board, source: checkonchain
At the same time, the indicators Days to Cover and Days to Replace have also been proposed to help observe the "buying" trend of listed companies, the former measures the time it takes for a company to cover the valuation premium at the current rate, and the latter evaluates the pace of doubling the current position.
At the same time, with MicroStrategy (MSTR) accounting for nearly eighty percent of the listed company's Bitcoin holdings, its market dynamics are being seen as an important bellwether for Bitcoin price movements, James Check said that observing the movement of the three preferred stocks recently issued by MSTR, convertible bonds STRK, investment-grade bonds STRF and high-risk STRDs will be a good top warning signal, once the price of these preferred shares falls below the par price of $100, This means that the market is beginning to reassess the financing sustainability of MSTR and the potential risks of Bitcoin exposure. Through changes in bond yields and credit premiums, investors can gain early insight into possible market top signals.
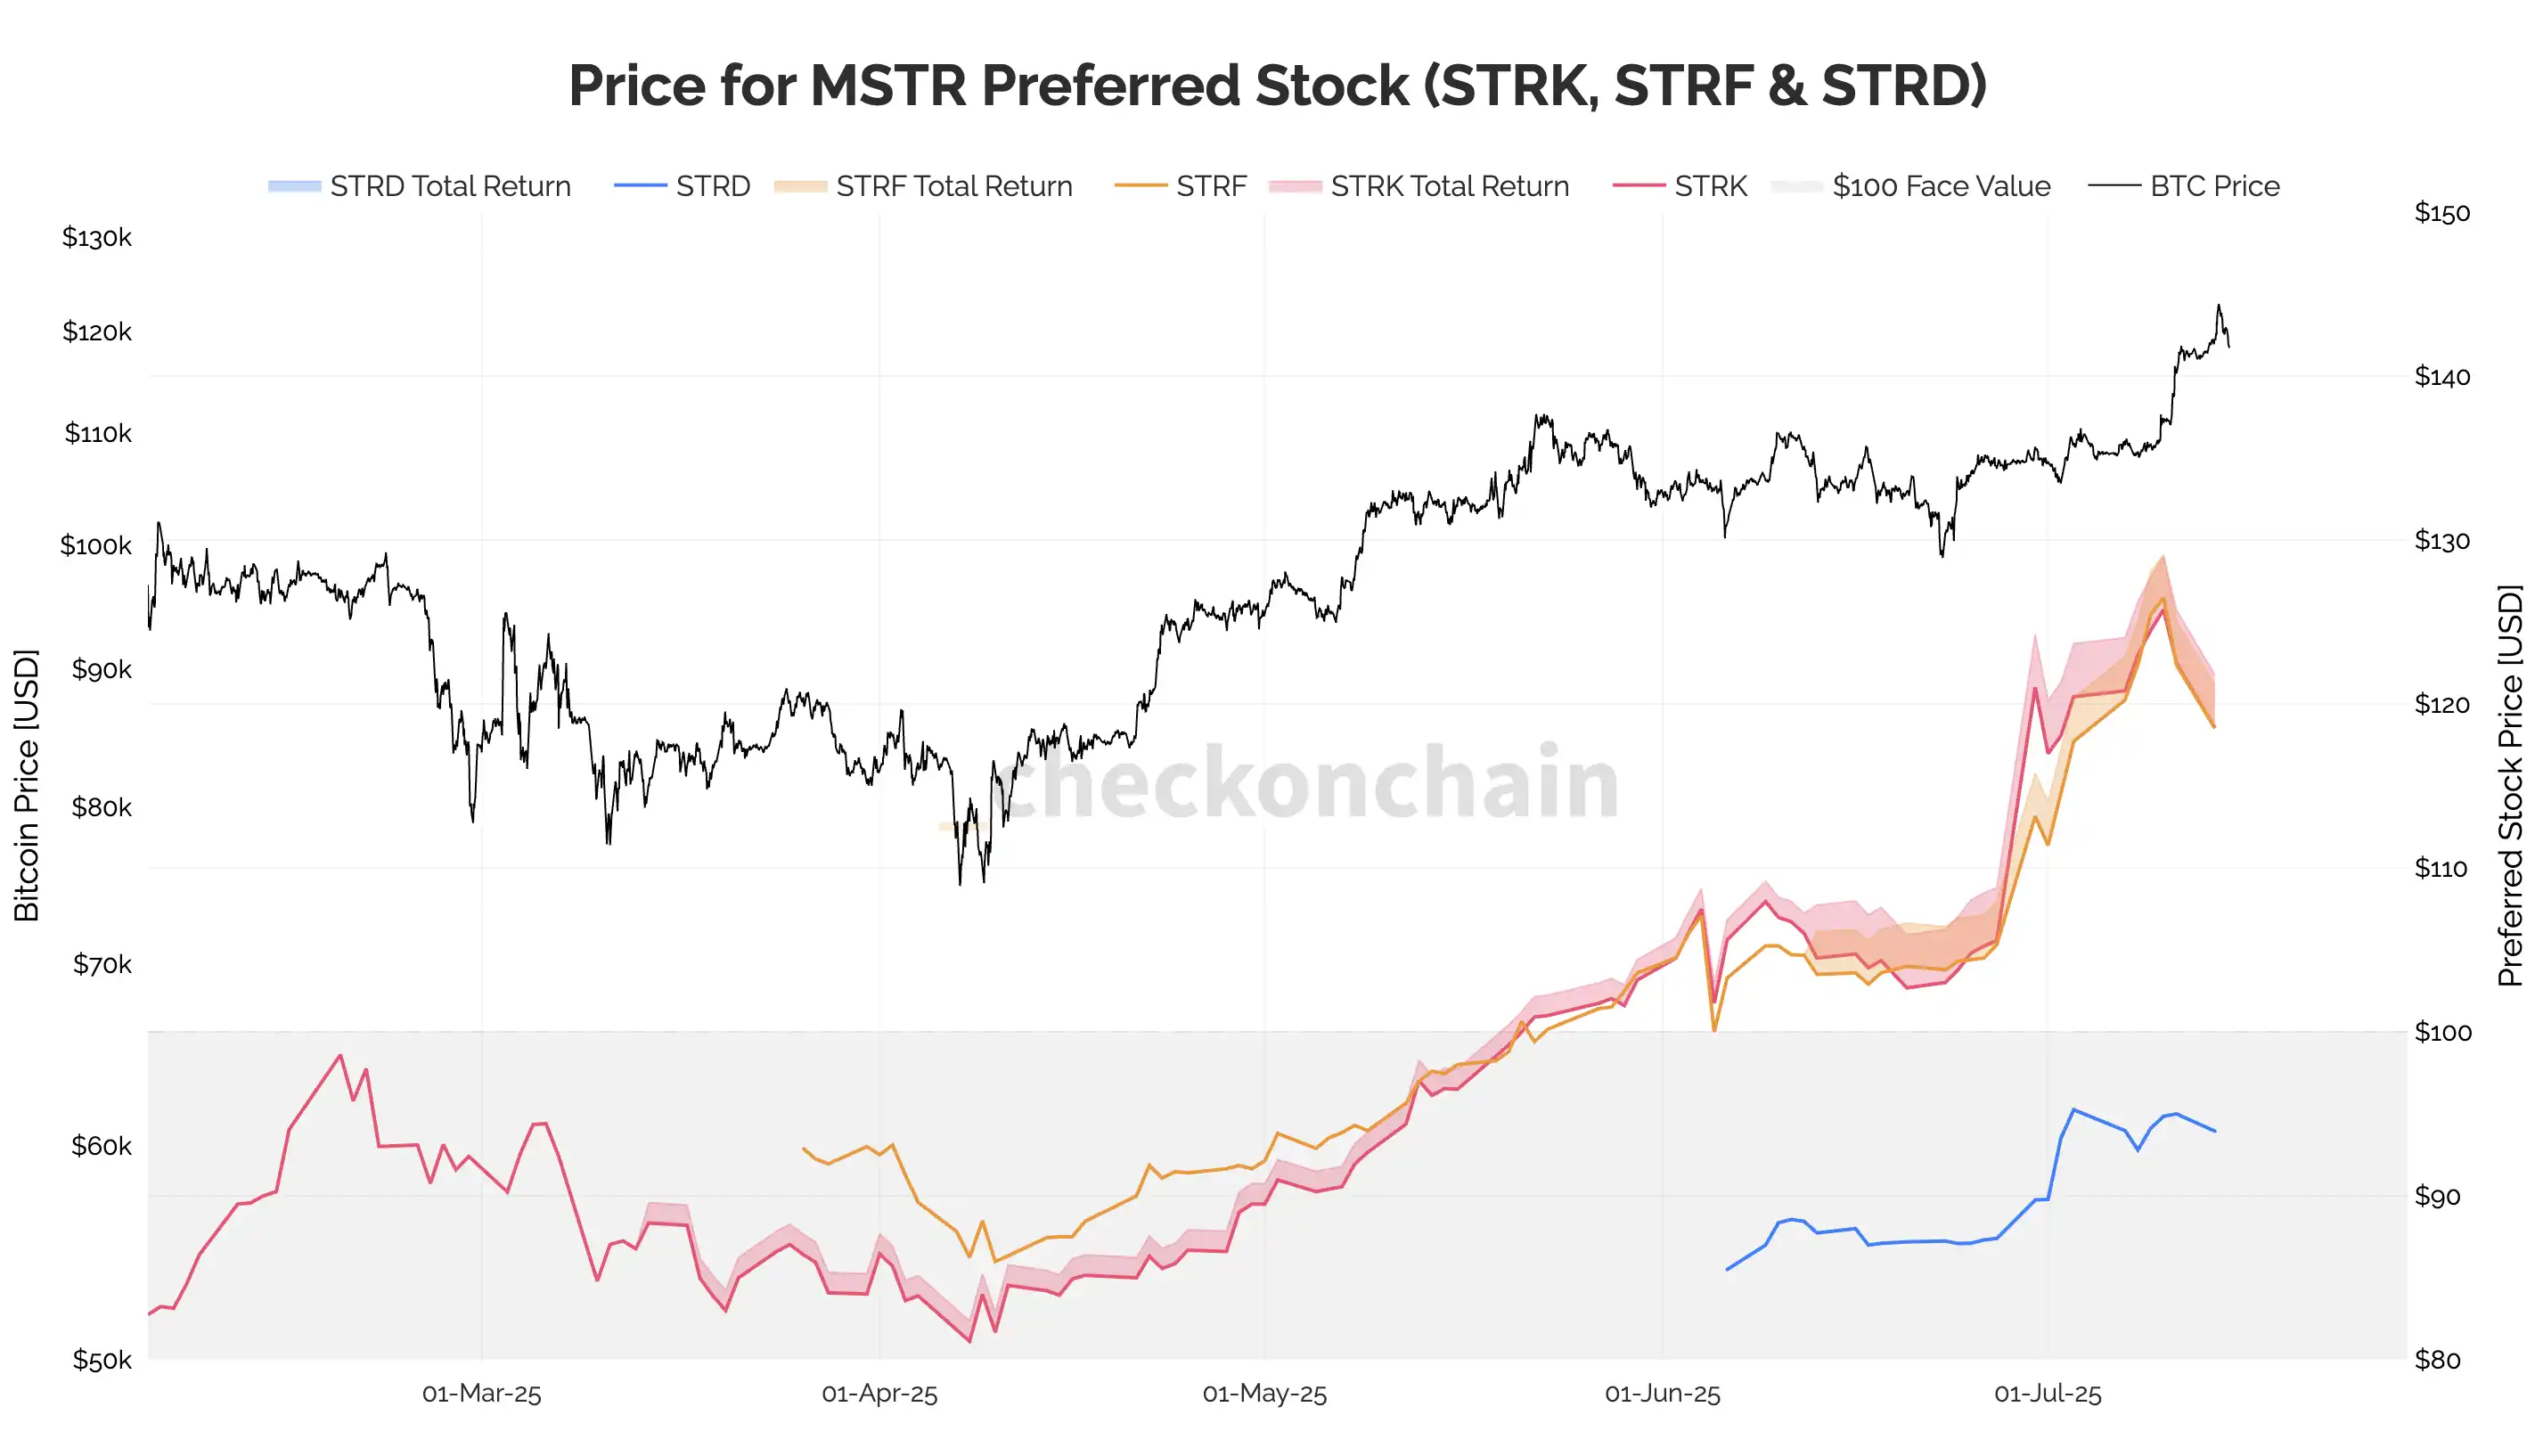
MSTR Three Preferred Stock Movements, Source: Checkonchain
At a time when institutional capital has become the main force of Bitcoin's rise, the credit cycle and asset leverage of "crypto vault" companies such as MSTR are quietly constituting a systemic variable in the new generation of Bitcoin market.
BTC's financial attributes have shifted
Judging from the MVRV data, the price of bitcoin in the current cycle is healthier than the previous round. The 17-year-old MVRV showed a perfect "tulip bubble"; And in '21, FTX and other institutions entered the market and increased leverage, resulting in MVRV being a roller coaster. This year's MARV data curve is smoother and more natural. It shows the characteristics of "disorder becomes orderly, irregular sharp turn straight up and down slowly turns to regular fluctuations, and the demand side is healthier and more real".
@Trader_S18 said that after the passage of the CLARITY Act, Bitcoin's Nasdaq attributes may be reduced, while commodities will be enhanced. That is to say, the reference target of the future pie trend may change from U.S. stocks to a greater proportion following the trend of crude oil, gold, copper, and soybeans. For example, after Trump threatened to impose a 100% tax hike on Russia, WTI went lower, and the pie fluctuated.
The formation of wide-area consensus and the rising cost of Bitcoin holdings have become key points of bull market support
On-chain analyst James Check recently released a study, pointing out that the current Bitcoin market is showing highly healthy structural characteristics, among which "holding costs continue to rise" and "long-term holders (LTH)" have become the core variables supporting the continuation of the bull market.
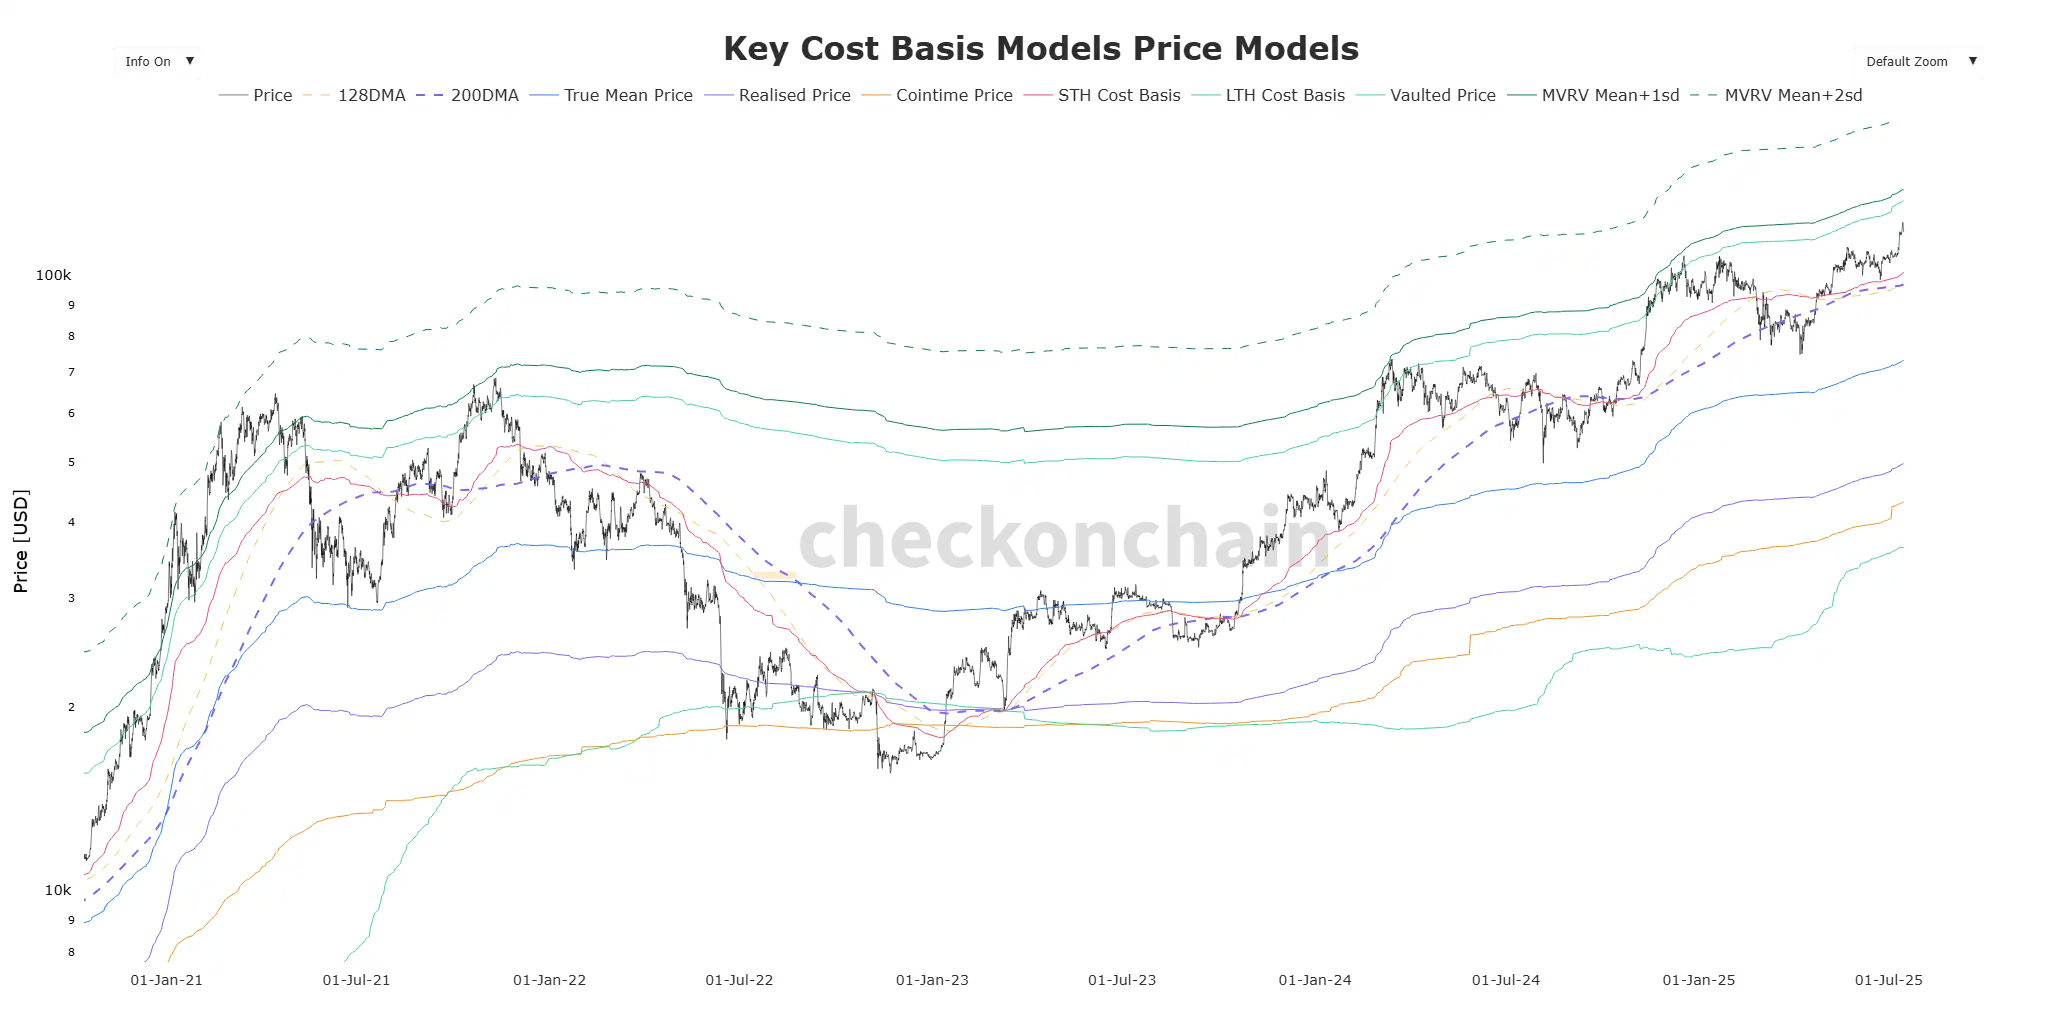
Key cost price model
In the key cost price model constructed by the company, it can be clearly observed that the relative holding cost of the market as a whole has increased significantly compared with the previous quarter. This means that with each price correction, the "average cost of buying" of the market will rise accordingly, forming a higher chip bearing area. According to URPD-R indicator data, more than 55% of the holding costs of Bitcoin are currently concentrated in more than $90,000, building a strong on-chain support band. James Check stressed that unless there is an extreme systemic event, the range will not be easily broken.
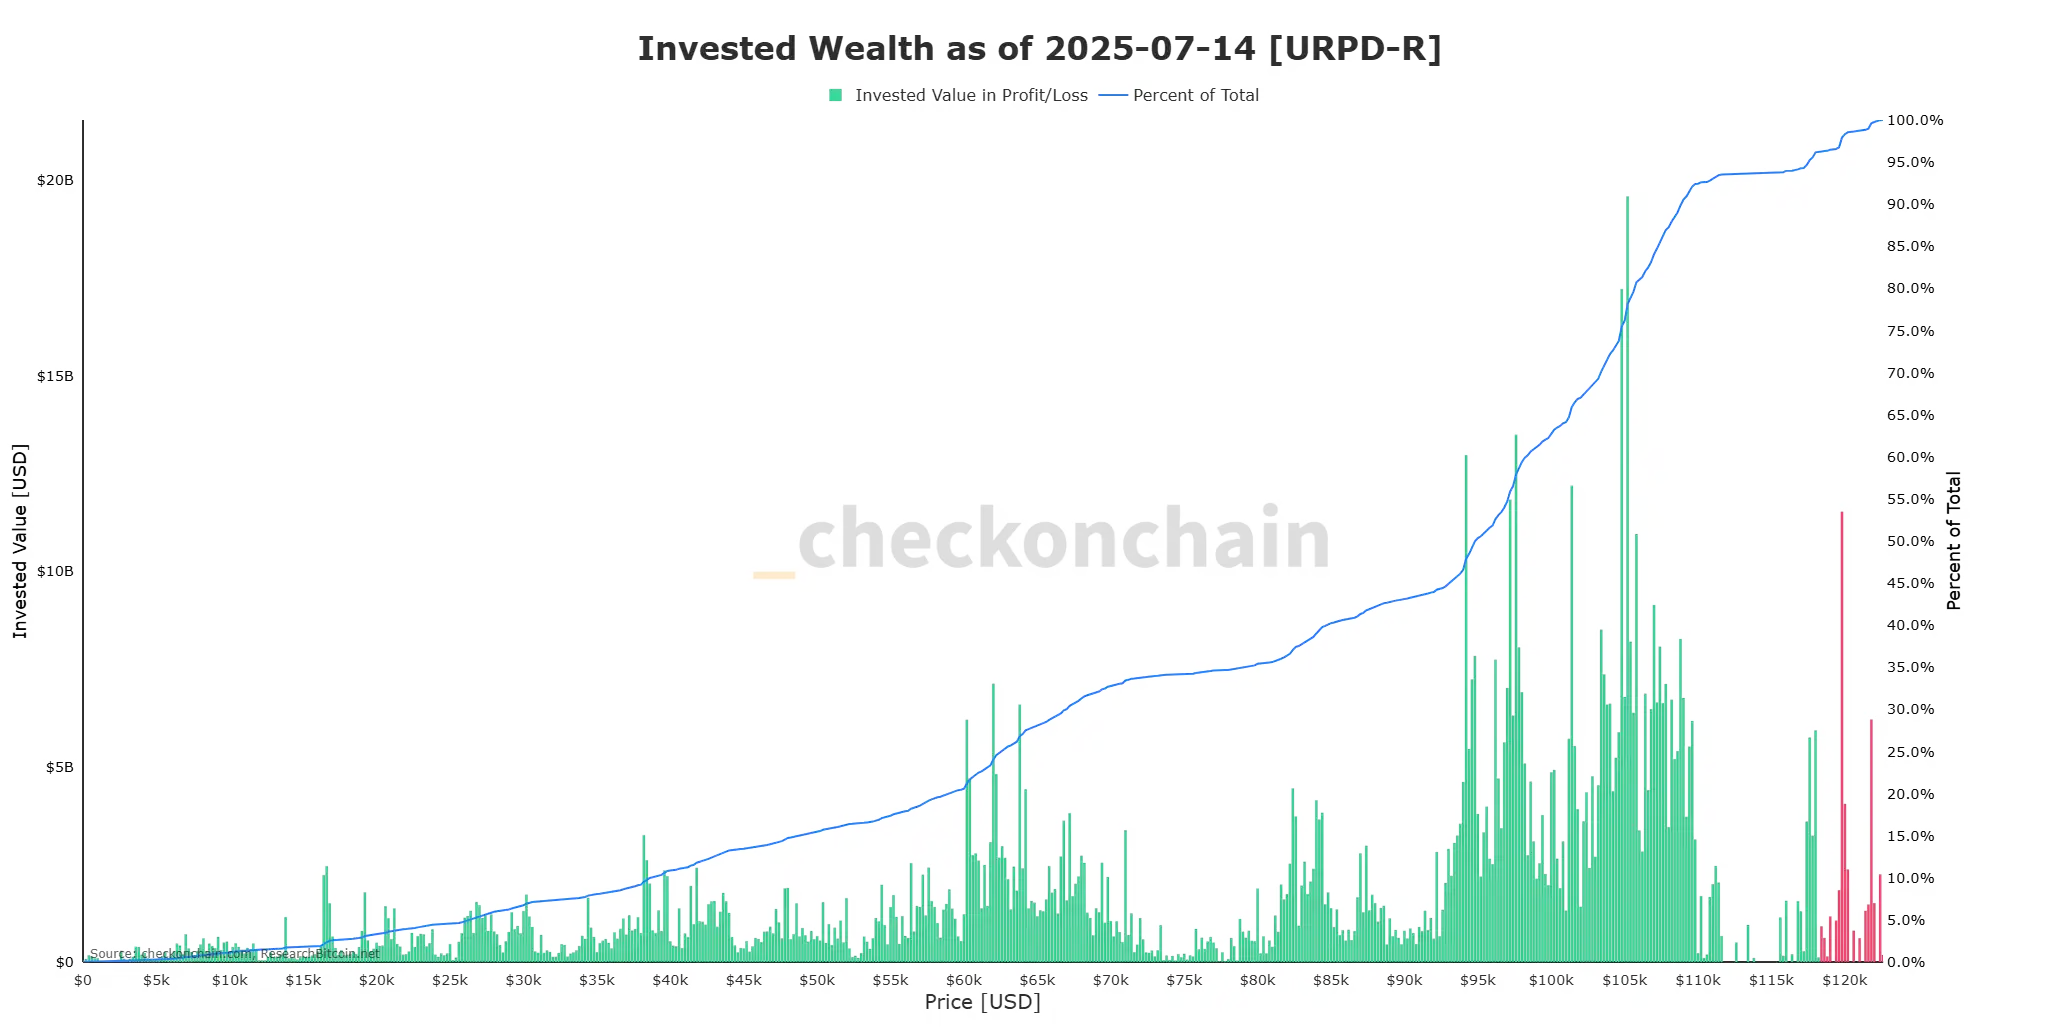
Investment wealth by realized cost as of Jul 14, 2025
At the same time, the LTH (Long-Term Holder) indicator releases a rare historical signal. As of July 14, 2025, about 80% of Bitcoin has not been transferred in the last five months, meaning that market chips are extremely stable and selling pressure is scarce. According to the "Realized Value Distribution Heat Map" and the "Profit and Loss State Chart of Currency Holding Group", a large number of long-term holders still choose to continue to hold in the face of global uncertainties (such as geopolitics, stock market adjustments, and tariff fluctuations), showing a firm belief structure.
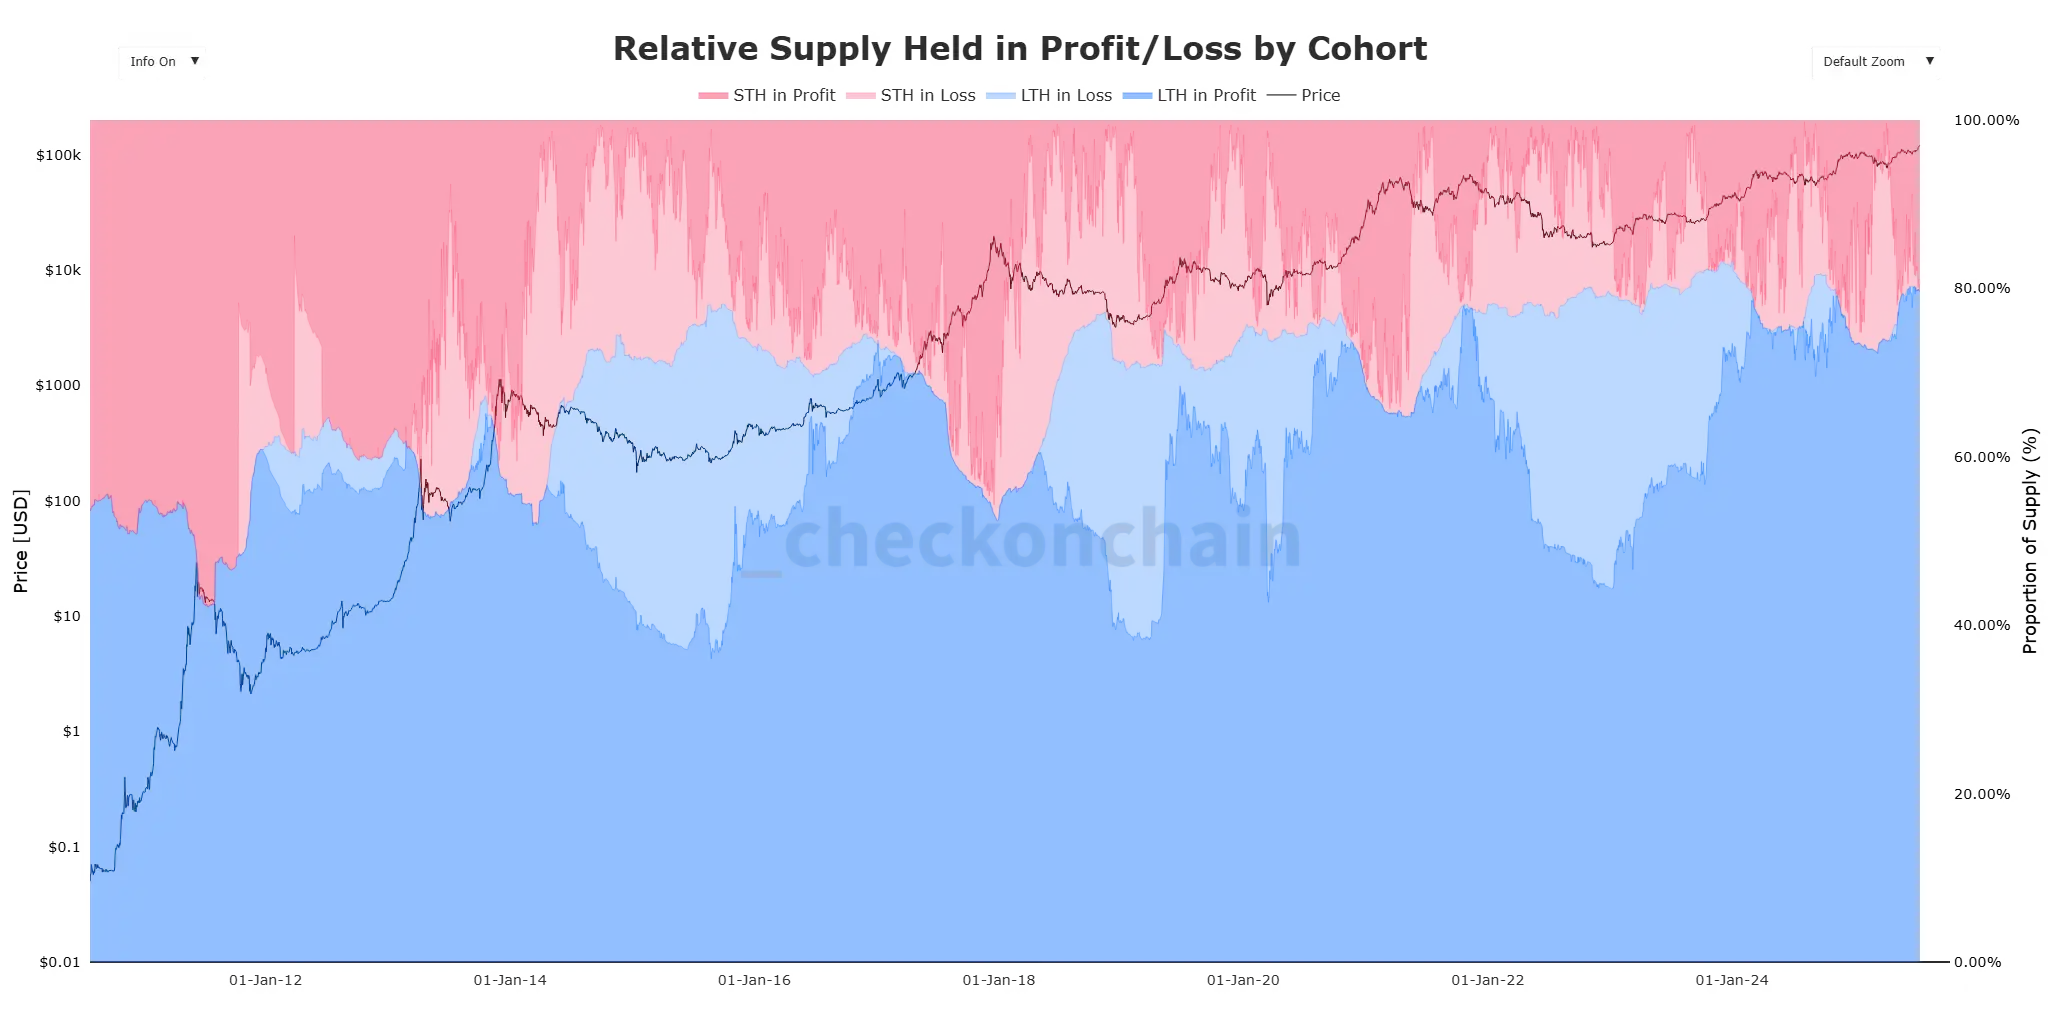
The relative amount of coins held by each token holding group in the state of profit and loss
@_43A6 also further interprets the "Peak HODL" signal, that is, after LTH holdings reach their peak, the market often starts with a bull market. The average cost of LTH is about $35,000, and if the MVRV (market capitalization to realized value ratio) reaches 5 as the extreme bull market top reference, the theoretical top price mentioned by James Check can be as high as $175,000, but the probability of this extreme scenario is extremely low, and most long-term holders will gradually cash out at the "life change" return point (such as 5x, 10x return) instead of smashing the market all at once.
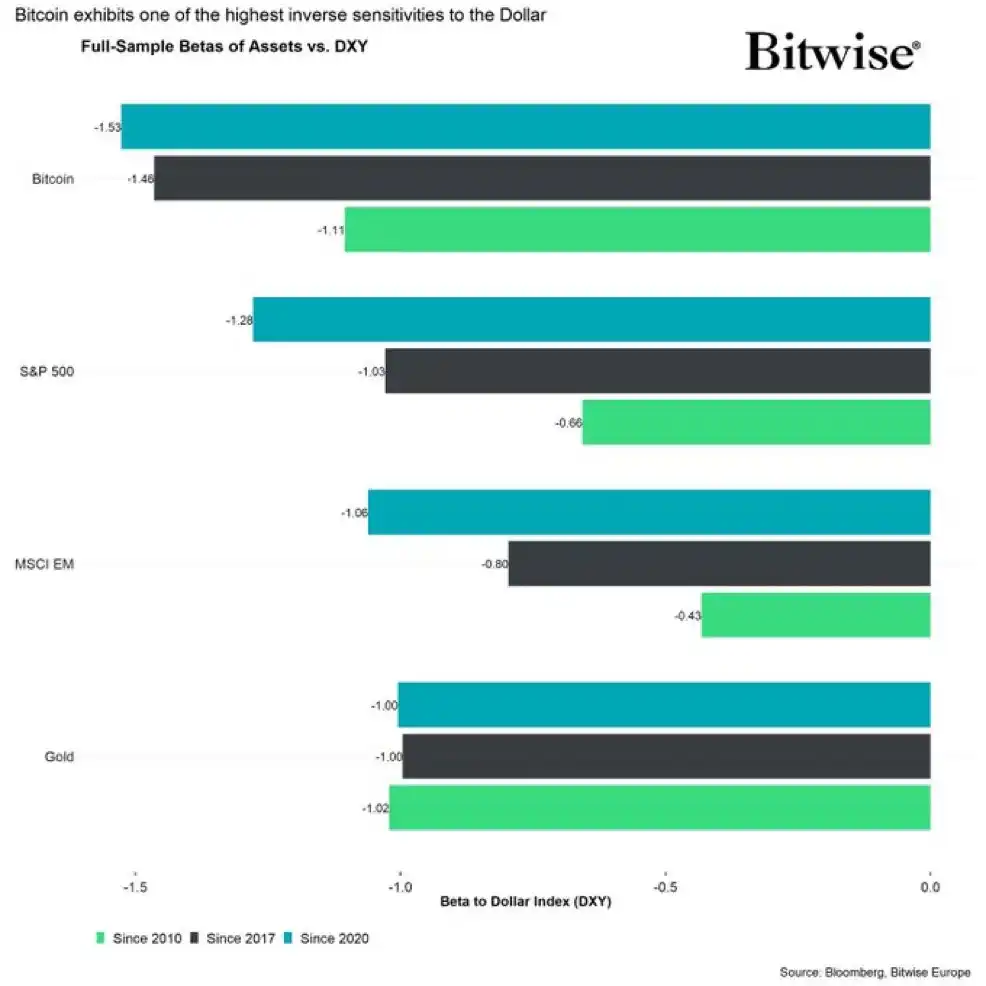
André Dragosch, PhD, on the other hand, cites data to explain part of the reason for this phenomenon, saying that "Bitcoin hit new highs because the dollar fell by more than 10% in 2025, and Bitcoin didn't go up, just depreciated" is wrong, and in fact the beta of Bitcoin against the dollar is about -1.5, and BTC has risen much more than the depreciation of the dollar itself suggests. This means that the active appearance of LTH is the core embodiment of the healthy market structure, the maturity of chips and the release of real value, rather than a simple monetary illusion.
Can you be bearish?
Well-known observer artist Crypto_Painter said that after the price of bitcoin briefly rushed to $123,000, the premium index in the spot market continued to fall, while the open interest did not fall at the same time, indicating that there is a clear high price of US investors. At the same time, the long positions in the futures market are still taking over, forming a mismatch between the "dark sale" of spot and the "hard connection" of futures. He pointed out that if this structure continues, the market may usher in a wave of technical correction in the short term, and it is recommended that short-term bulls tighten their stops until the spot premium is repaired.
However, Crypto_Painter also stressed that there has not been a fundamental disruption from the overall trend structure, so he maintains the judgment of "pullback and not bearish". He further pointed out that although the current market has experienced a relatively large initial correction and short-term risks have been released, the medium-term risks faced by the market are accumulating because the premium has not yet recovered. Although the bulls can support the price in the short term in the pullback, the trend will be difficult to continue in the context of the continuous downward trend of premiums.
He expects that the market will most likely enter a period of volatility to wait for capital sentiment and structural repair. In the current range, the three potential green support bands shown in the chart are still valid, and it is not advisable to turn bearish unless they are all broken. What is really worth being wary of is that when the price falls and the premium falls further, it may trigger a deeper market decline and form a trend reversal signal. Crypto_Painter concluded, "In the current situation, we are not afraid of a pullback, but we are afraid that the premium will get out of control."
Trader Eugene Ng Ah Sio also chose to wait and see, posting an analysis of the ETH/BTC exchange rate on his personal channel, saying: "While the price action over the past week has been encouraging, I need to see ETH/BTC break out of the current 0.022-0.027 range to confirm a structural breakout. My short-term target is 0.03, which is now within reach. If Ethereum can hold the $4,000 mark, the 0.04+ target on the higher timeframe will also come into view. If this judgment is true, there will be a huge amount of room for manoeuvre."
Although Bitcoin broke through the all-time high and market sentiment was high, looking back at the political upheaval, regulatory restructuring and capital structure transfer experienced this year, this round of Bitcoin rally is no longer a simple price fluctuation, but a systematic revaluation intertwined with global capital, institutional signals and technical beliefs.
When the impetus for the bull market shifts from retail speculation to institutional entry, from the liquidity game to the upgrading of the position structure, it seems that the narrative of the rise has changed from a four-year cycle of "bull market" to whether this is the "beginning of a new crypto order".