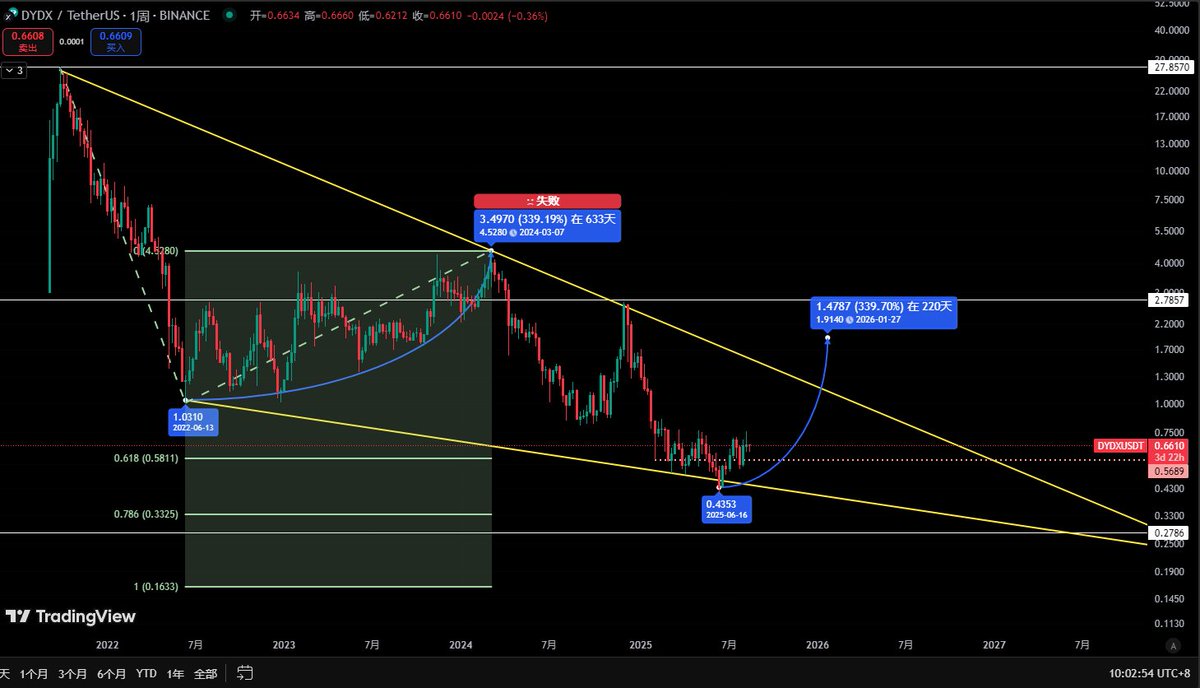
A coin friend asked $DYDX
1. The shape is a falling wedge, and it has fallen below the issue price. (The chart history is not sure whether it is complete, you can check it yourself)
2. Although Fibonacci has stepped back on 0.618Fib, I personally think it is a relatively low point; if you want to meet the $OM script, it may step back to between 0.786-1Fib.
3. The conservative target price is around 1.91, and the actual target price measurement method can pull the same amplitude at an opening from the breakthrough level.
4. The white line is 10 times the price, which feels more reasonable, and the white line in the middle has strong resistance, and it has been washed for a long time. If the first wave can go up, the currency price touches around 2.78, and half of it can be considered.
Show original
11.75K
18
The content on this page is provided by third parties. Unless otherwise stated, OKX TR is not the author of the cited article(s) and does not claim any copyright in the materials. The content is provided for informational purposes only and does not represent the views of OKX TR. It is not intended to be an endorsement of any kind and should not be considered investment advice or a solicitation to buy or sell digital assets. To the extent generative AI is utilized to provide summaries or other information, such AI generated content may be inaccurate or inconsistent. Please read the linked article for more details and information. OKX TR is not responsible for content hosted on third party sites. Digital asset holdings, including stablecoins and NFTs, involve a high degree of risk and can fluctuate greatly. You should carefully consider whether trading or holding digital assets is suitable for you in light of your financial condition.

