You're gonna make me say it
Blockworks Analytics (@blockworksres) is an incredible resource for tracking some of the most important metrics in the crypto space. And many of their charts are free (don’t even need to sign up). Here are a few of my favorite free charts I like to monitor to keep a pulse on what’s going on on-chain.
1. Network Real Economic Value (REV)
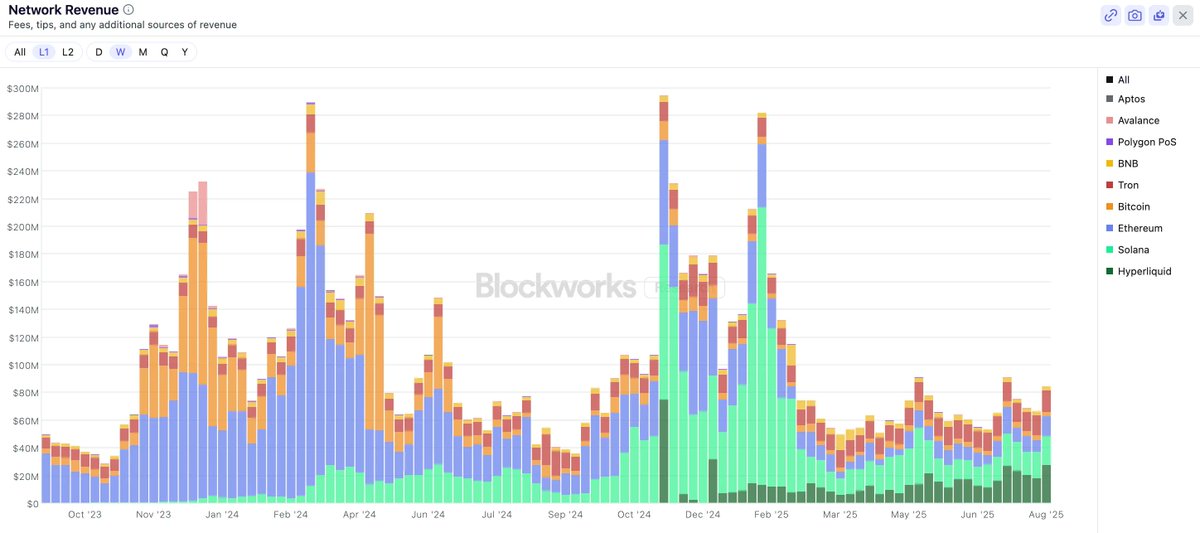
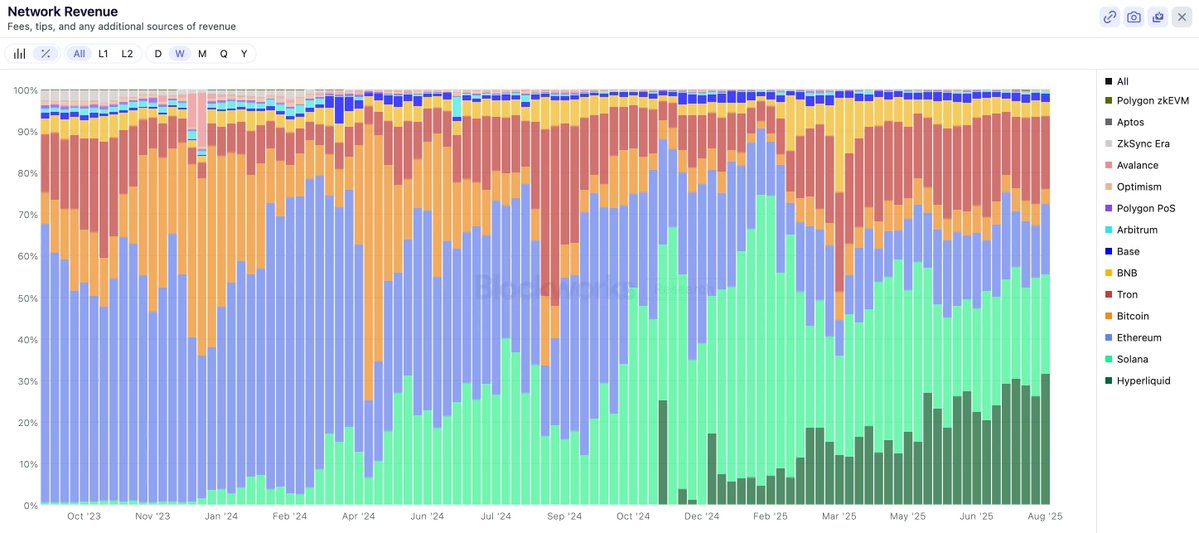
This chart captures the “real economic value” across different Layer 1 blockchains, which is calculated by adding transaction fees and priority fees/tips to approximate demand for transacting on each network. Ethereum was super high back in 2022–23 when network demand drove exceptionally high transaction fees. Solana moved into a dominant position in mid-2024, and Hyperliquid has just recently taken the top spot (though I think it’s odd to include Hyperliquid here since they do have an L1, HyperEVM, with REV below $100k per week).


10.53K
22
The content on this page is provided by third parties. Unless otherwise stated, OKX TR is not the author of the cited article(s) and does not claim any copyright in the materials. The content is provided for informational purposes only and does not represent the views of OKX TR. It is not intended to be an endorsement of any kind and should not be considered investment advice or a solicitation to buy or sell digital assets. To the extent generative AI is utilized to provide summaries or other information, such AI generated content may be inaccurate or inconsistent. Please read the linked article for more details and information. OKX TR is not responsible for content hosted on third party sites. Digital asset holdings, including stablecoins and NFTs, involve a high degree of risk and can fluctuate greatly. You should carefully consider whether trading or holding digital assets is suitable for you in light of your financial condition.


