Global M2 Money Supply vs Bitcoin
Next move up soon?
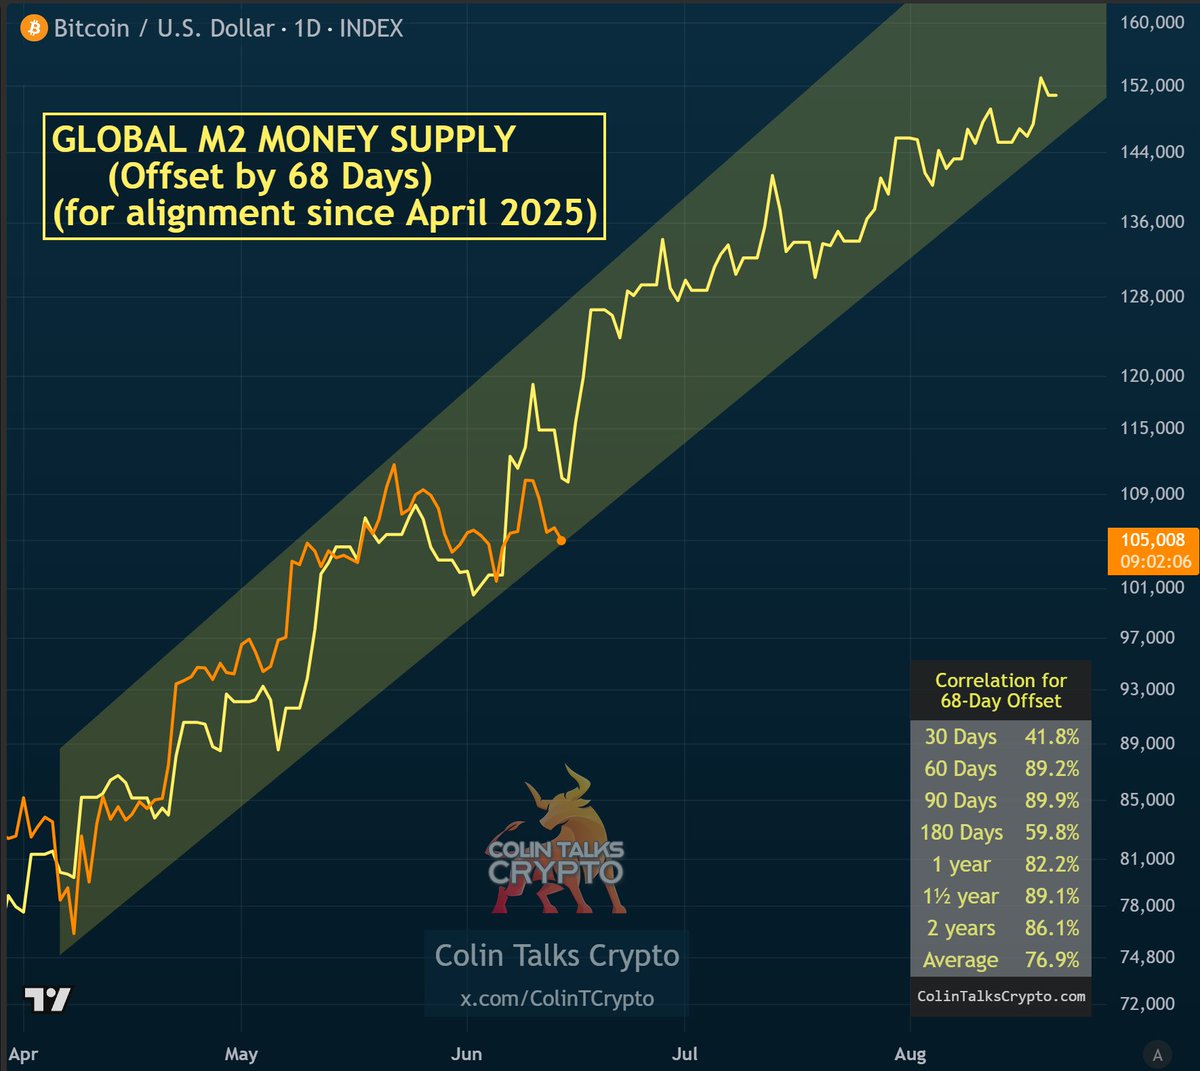
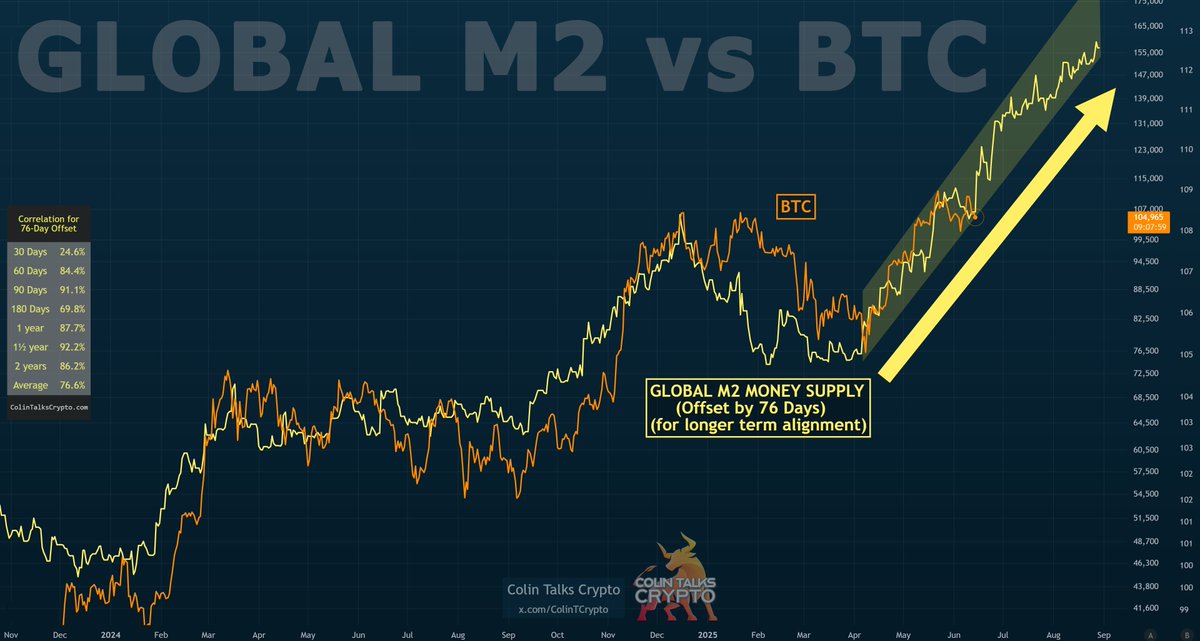
Charts pictured: 68 & 76 day offsets
Both have a high average mathematical correlation (76.9% and 76.6%) as shown on the bottom of the table in each chart.
76 day is the more accurate long term offset imo, but 68-day gives us the closest short term visual correlation (since April).
Key takeaway:
👉 BOTH are showing a move up for BTC soon. 👈
How I'm reading this: This is a form of confluence (both charts showing the same near-term next move). This raises probability of a move up coming soon. Within days most likely.
Let's see how it plays out over the coming days. 👀
If these charts are correct, it could get fun soon.


84.77K
1.35K
The content on this page is provided by third parties. Unless otherwise stated, OKX TR is not the author of the cited article(s) and does not claim any copyright in the materials. The content is provided for informational purposes only and does not represent the views of OKX TR. It is not intended to be an endorsement of any kind and should not be considered investment advice or a solicitation to buy or sell digital assets. To the extent generative AI is utilized to provide summaries or other information, such AI generated content may be inaccurate or inconsistent. Please read the linked article for more details and information. OKX TR is not responsible for content hosted on third party sites. Digital asset holdings, including stablecoins and NFTs, involve a high degree of risk and can fluctuate greatly. You should carefully consider whether trading or holding digital assets is suitable for you in light of your financial condition.

