#BTC【Five-Line Chart】Update, Current——
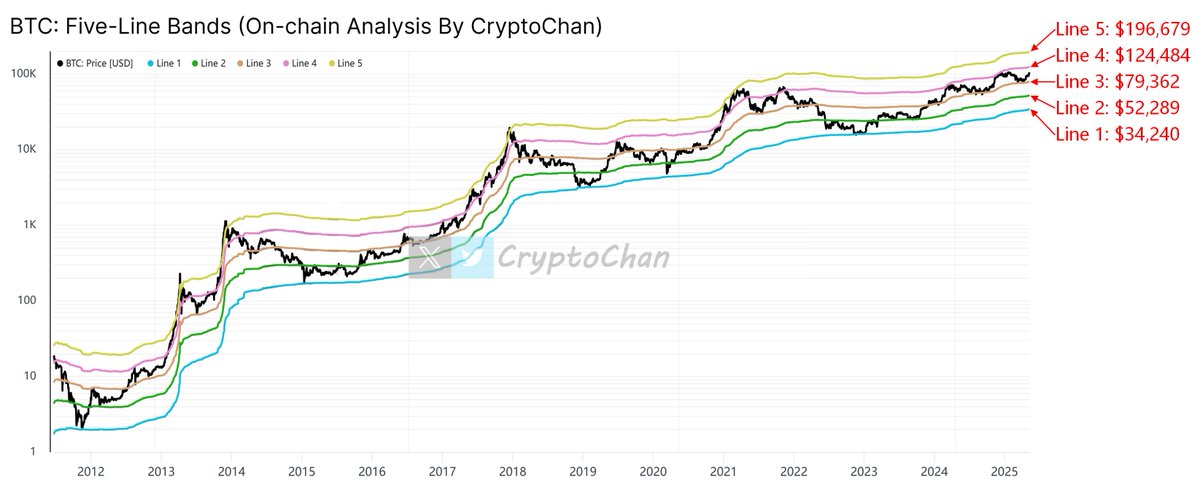
Line 5: $196,679
Line 4: $124,484
Line 3: $79,362
Line 2: $52,289
Line 1: $34,240
The chart represents a long-term Bitcoin price model. This model is designed based on on-chain data such as Coin Days Destroyed, Liquid Supply, and Realized Price. It uses five lines to comprehensively divide the entire historical price range from peak to bottom.

【Bitcoin Five-Line Chart Update】
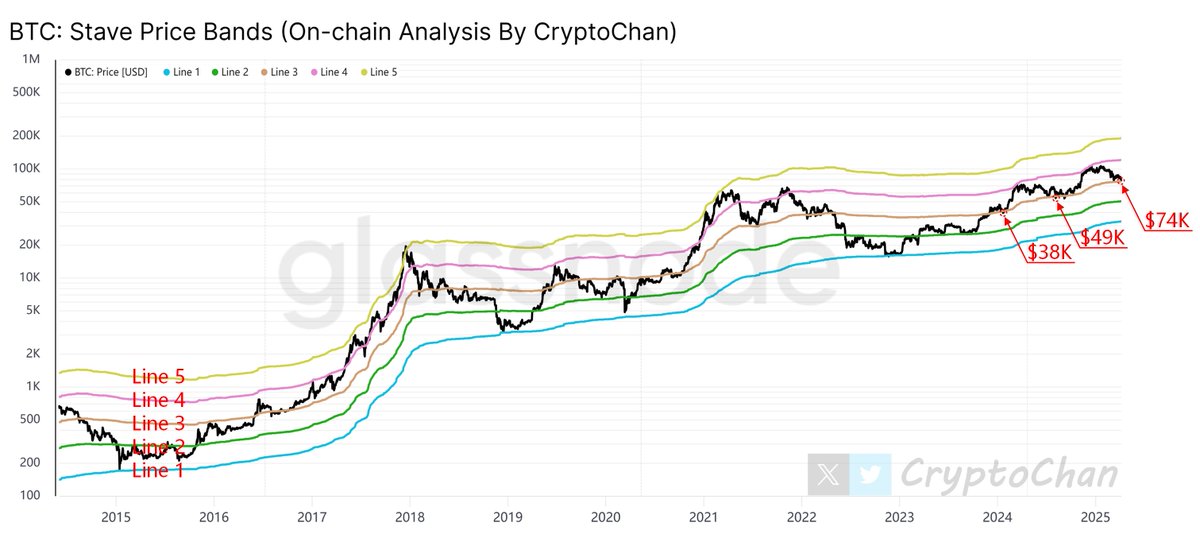
Time has proven once again that my big Line3 has heroically turned the tide! ($38K, $49K, $74K)
Little Powell, little Federal Reserve, all under control! 😎
The chart shows a #BTC price macro-cycle model. This model is designed based on on-chain data such as Coin Days Destroyed, Liquid Supply, and Realized Price. It uses five lines to comprehensively divide and encompass the entire historical price range of Bitcoin from peak to bottom.

28.55K
94
The content on this page is provided by third parties. Unless otherwise stated, OKX TR is not the author of the cited article(s) and does not claim any copyright in the materials. The content is provided for informational purposes only and does not represent the views of OKX TR. It is not intended to be an endorsement of any kind and should not be considered investment advice or a solicitation to buy or sell digital assets. To the extent generative AI is utilized to provide summaries or other information, such AI generated content may be inaccurate or inconsistent. Please read the linked article for more details and information. OKX TR is not responsible for content hosted on third party sites. Digital asset holdings, including stablecoins and NFTs, involve a high degree of risk and can fluctuate greatly. You should carefully consider whether trading or holding digital assets is suitable for you in light of your financial condition.

